KPIs
At Group level, we measure the performance of the business using a number of key performance indicators (‘KPIs’). These help to ensure that we are delivering against our strategic priorities. Several of these KPIs (adjusted EPS, return on investment, leverage and carbon intensity) influence the remuneration of our executive team.
Certain KPIs are more appropriately measured for each of our operating businesses, whereas other KPIs are best measured for the Group as a whole.
Key performance indicator linkages
![]() Customer
Customer![]() Growth
Growth![]() Performance
Performance![]() Sustainabiity
Sustainabiity![]() Investment
Investment![]() Linked to remuneration
Linked to remuneration
ADJUSTED EPS (¢)
Calculation
Adjusted Group profit after taxation divided by the weighted average number of shares in issue (excluding shares held by the Company and the ESOT).
Target
As a cyclical business, adjusted EPS varies through the cycle.
2024 performance
Adjusted EPS was 386.5¢ per share in 2023/24.
Strategic priorities
![]()
![]()
![]()
![]()
RETURN ON INVESTMENT (‘RoI’) (%)
Calculation
Last 12-month (‘LTM’) adjusted operating profit divided by the LTM average of the sum of net tangible and intangible fixed assets, plus net working capital but excluding net debt and tax. RoI is calculated excluding the impact of IFRS 16.
Target
Averaged across the economic cycle we look to deliver RoI well ahead of our cost of capital, as discussed in our strategic review.
2024 performance
Our RoI was 16% for the year ended 30 April
2024. The decrease in RoI compared with the
prior year is predominantly due to the impact
of a lower utilisation of a larger fleet.
Strategic priorities
![]()
![]()
![]()
![]()
![]()
NET DEBT AND LEVERAGE AT CONSTANT EXCHANGE RATES
Calculation
Net debt is total debt less cash balances, as reported, and leverage is net debt divided by EBITDA, calculated at constant exchange rates (balance sheet rate). Both net debt and leverage exclude the impact of IFRS 16.
Target
We seek to maintain a conservative balance sheet structure with a target for net debt to EBITDA of 1.0 to 2.0 times (excluding IFRS 16).
2024 performance
Excluding lease liabilities arising under IFRS 16, net debt at 30 April 2024 was $8,014m and leverage was 1.7 times.
Strategic priorities
![]()
![]()
FLEET ON RENT ($m/C$m/£m)
Calculation
Fleet on rent is measured as the daily average of the original cost of our itemised equipment on rent.
Target
To achieve growth rates in excess of the growth in our markets and that of our competitors.
2024 performance
In the US, fleet on rent increased 12% (rental revenue up 11%), in Canada, fleet on rent increased by 26% (rental revenue up 10%), while in the UK it increased by 7% (rental revenue up 6%). The US market increased by 13%, the Canadian market by 5% and the UK market by 3%.
Strategic priorities
![]()
![]()
![]()
DOLLAR UTILISATION (%)
Calculation
Dollar utilisation is rental revenue divided by average fleet at original (or ‘first’) cost measured over a 12-month period.
Target
Improve dollar utilisation to drive improving returns in the business.
2024 performance
Dollar utilisation was 58% in the US, 47% in Canada and 53% in the UK. The decrease in US dollar utilisation is due to principally lower physical utilisation while Canadian dollar utilisation reflects both lower physical utilisation and the drag of the Film & TV business.
Strategic priorities
![]()
![]()
![]()
EBITDA MARGINS (%)
Calculation
EBITDA as a percentage of total revenue.
Target
To improve or maintain margins with EBITDA margins of 40-50% in the US, 40-45% in Canada and 35-40% in the UK.
2024 performance
EBITDA margins in 2023/24 were 47% in the US, 40% in Canada and 28% in the UK.
Strategic priorities
![]()
CARBON INTENSITY (TCO2E/$M)
Calculation
Carbon intensity is calculated as emissions per $m of revenue (tCO2e/$m), calculated at constant exchange rates.
Target
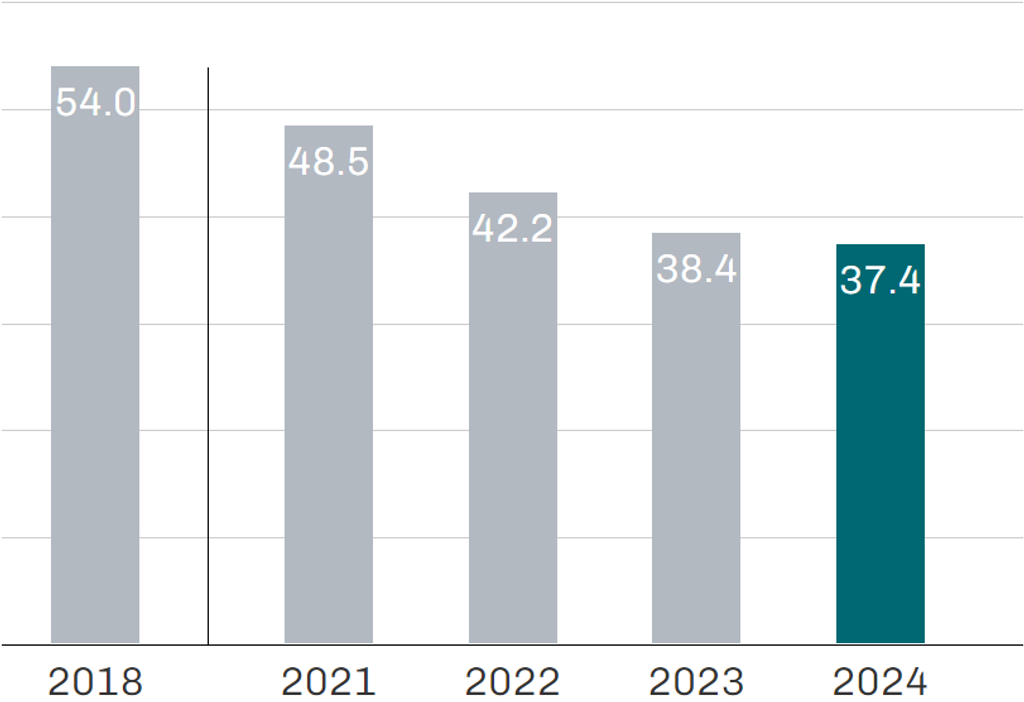
To reduce our carbon intensity by 35% by 2030 with reference to 2018 as a base year, with a shorter-term target of 15% by 2024.
2024 performance
Our carbon emission intensity ratio was 37.4 (2023: 38.4).
Strategic priority
![]()
![]()

STAFF TURNOVER (%)
Calculation
Staff turnover is calculated as the number of leavers in a year (excluding redundancies) divided by the average headcount during the year.
Target
Our aim is to keep employee turnover below historical levels to enable us to build on the skill base we have established and maintain and enhance the culture of the business.
2024 performance
Employee turnover in the US was 20%, in Canada 21% and in the UK 24%.
Strategic priority
![]()
SAFETY
Calculation
In North America, reportable incidents are reported in accordance with the OSHA (Occupational, Safety and Health Administration) framework as a Total Recordable Incident Rate (‘TRIR’). In the UK, the RIDDOR (Reporting of Injuries, Diseases and Dangerous Occurrences Regulations) reportable rate is the number of major injuries or over seven-day injuries per 100,000 hours worked.
Target
Continued reduction in accident rates.
2024 performance
The TRIR was 0.76 in the US and 0.78 in Canada. The RIDDOR reportable rate was 0.19 in the UK.
Strategic priority
![]()

